YNPNdc’s commitment to diversity and inclusion is founded on our belief that a healthy, viable and inclusive nonprofit sector must reflect the richness of the communities it serves. We recognize the nonprofit workforce in the Metro DC region does not currently reflect the diversity of the community, and believe that greater access to professional development and networking can promote increased participation, retention, and career opportunities among groups that are currently under-represented within the nonprofit sector.
As a key resource for professional development and networking for young nonprofit professionals in the region, YNPNdc and our members are committed to fostering a more diverse and inclusive nonprofit workforce by:
- Actively engaging young nonprofit professionals from diverse backgrounds as YNPNdc members, event partners, speakers and organization leaders.
- Fostering the retention and career advancement of young nonprofit professionals from all backgrounds through responsive professional development programming.
- Enhancing the capacity of all nonprofit professionals to contribute to inclusive workplaces through professional development opportunities specifically focused on inclusion skill-building.
- Encouraging our members to build professional networks that reflect the cultural and professional diversity of our community.
Join the Diversity, Equity, and Inclusion Committee
Are you interested in envisioning a more inclusive community for young professionals? Join our new working group to create and implement a plan for cultivating a YNPNdc experience that is diverse, inclusive, and reflective of the greater D.C. young nonprofit professional community. Email Mae Diaz Cabrol if interested.
How we identify
At YNPNdc, we believe it is important to recruit and support Board members and volunteers who represent the diverse nonprofit sector in Washington, D.C. We know that the varied identities and experiences that we each hold inform our work to serve our sector. We are committed to holding ourselves accountable for the identities represented in the organization and using this information to recruit and engage volunteers and Members with different perspectives and life experiences.
We have collected data from both our Board Members and Program Managers who lead the organization, as well as our paid Members.
Age
- 18-22 (0)
- 23-27 (9)
- 28-32 (8)
- 33-37 (1)
- Older than 37 (0)
Race
- Asian or Asian American (1)
- Black or African American (4)
- Carribean Islander (1)
- Middle Eastern or North African (4)
- White, Caucasian, European (12)
Immigrant experience
- One Board member or volunteer identifies as an immigrant from the Middle East.
- Nine Board members or volunteers have immigrant family members or come from an immigrant family, from Hong Kong, Hungary, Italy, Egypt, Jamaica, and Iran.
Gender identity at time of survey
- Man (5)
- Woman (12)
- Non-binary (1)
- Transgender (1)
- Cisgender (2)
Pronouns
- She/her (12)
- He/him (5)
- They/them (1)
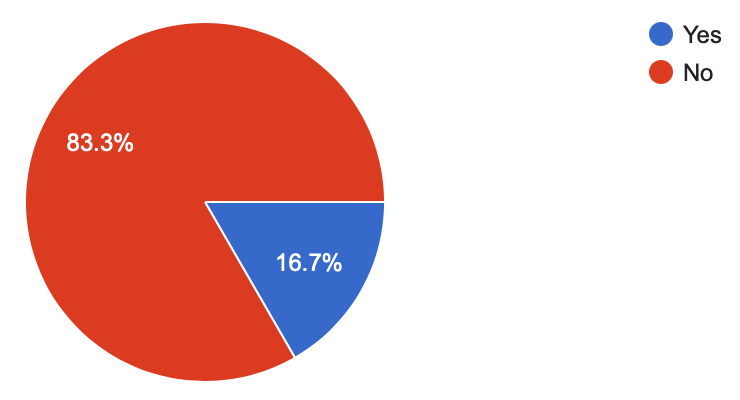
Identifies as a member of the LGBTQ+ community
Highest level of education
- Master’s Degree (11)
- Bachelor’s Degree (7)
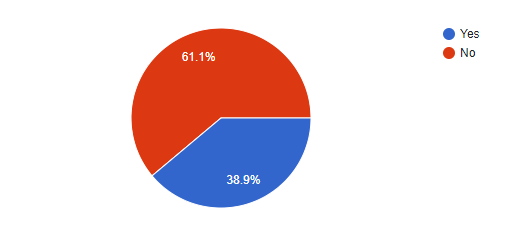
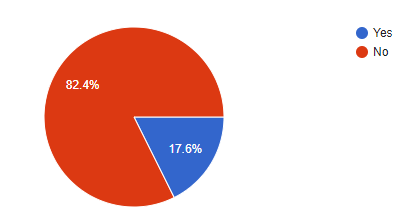
First-generation college student
Personal annual income or salary range
- Less than $10,000 (1)
- $25,000-$49,999 (1)
- $50,000-$74,000 (6)
- $75,000-$99,999 (7)
- $100,000-$149,999 (2)
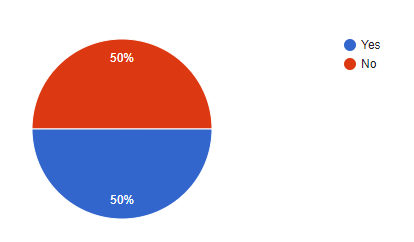
Considers self to have a disability
YNPNdc Members demographics
Age
- 18-22 (1)
- 23-27 (10)
- 28-32 (9)
- 33-37 (3)
- Older than 37 (1)
Race
- Asian or Asian American (1)
- Black or African American (3)
- Cuban, Hispanic, Latinx, Puerto Rican, Spanish (3)
- White, Caucasian, European (21)
- South Asian (1)
Immigrant experience
- Three Board members or volunteers identify as immigrants from Argentina and India.
- Four Board members or volunteers have immigrant family members or come from an immigrant family from India.
Gender identity at time of survey
- Man (13)
- Woman (20)
- Non-binary (2)
- Cisgender (3)
Pronouns
- She/her (20)
- He/him (3)
- They/them (4)
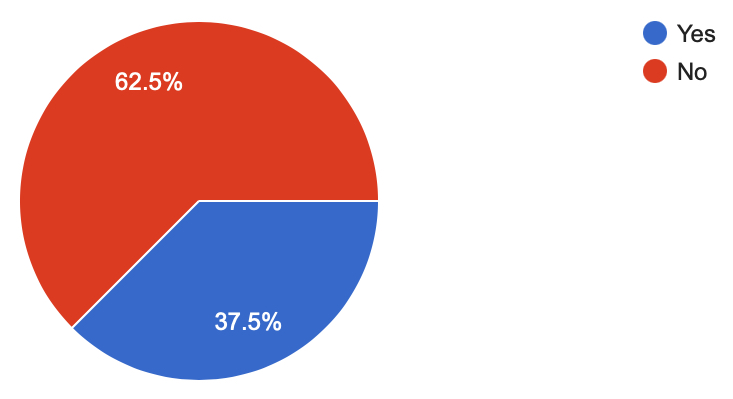
Identifies as a member of the LGBTQ+ community
Highest level of education
- Master’s Degree (15)
- Bachelor’s Degree (8)
- Associate’s Degree (1)
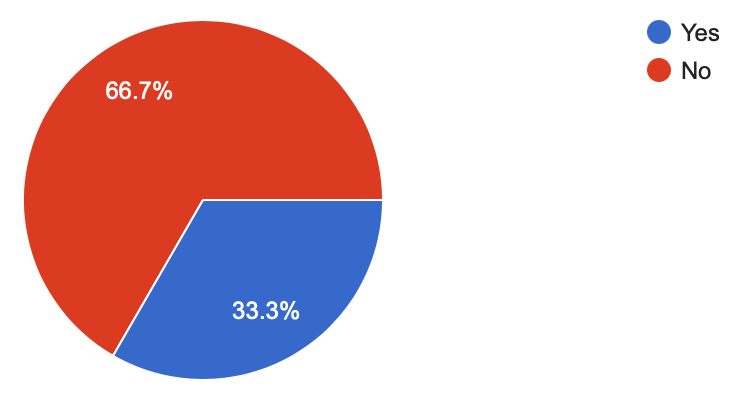
First-generation college student
Personal annual income or salary range
- Less than $10,000 (3)
- $50,000-$74,000 (10)
- $75,000-$99,999 (8)
- $100,000-$149,999 (3)
Considers self to have a disability
